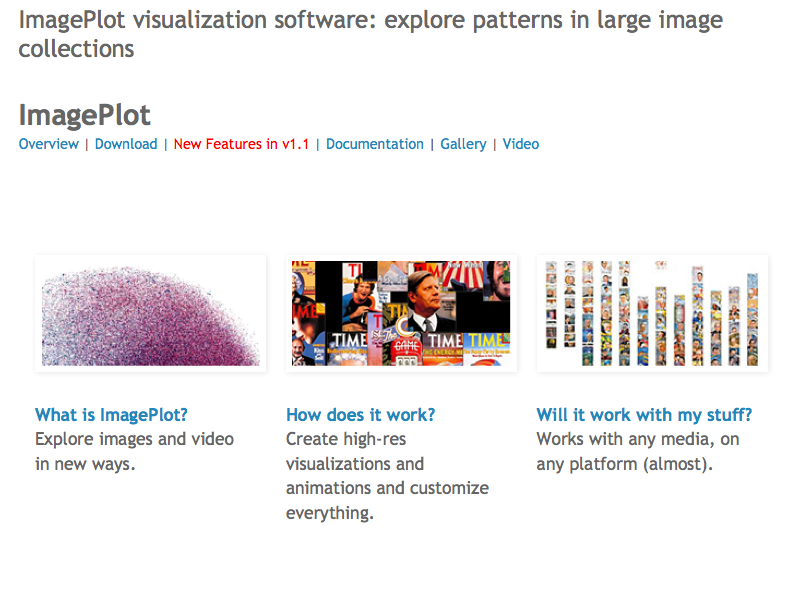

ImagePlot
Professor Lev Manovich and his Software Studies team have created ImagePlot, a free software tool that offers new ways of visualizing images and video.
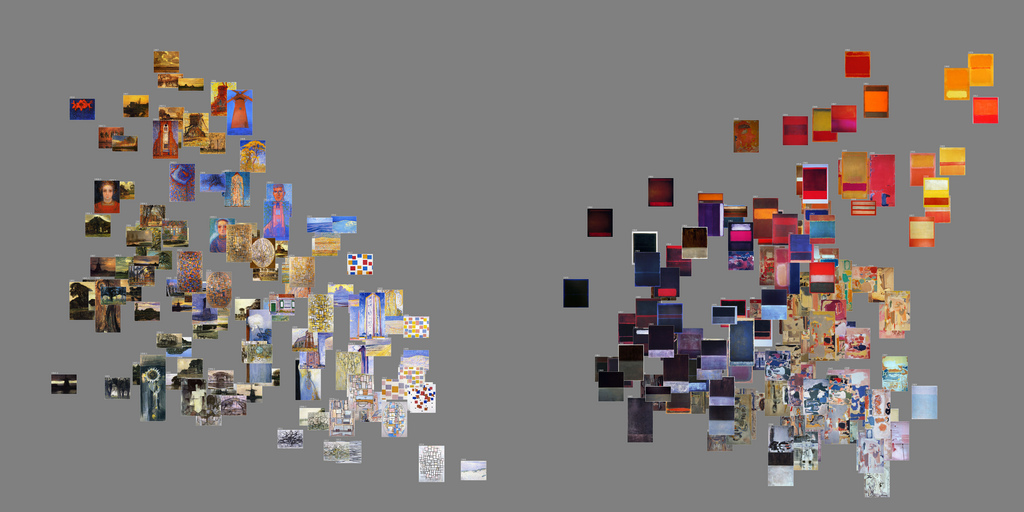
“Mondrian vs. Rothko” (above) demonstrates how image plots can be used to compare multiple data sets. In this case, the goal is to compare a similar number of paintings by Piet Mondrian and Mark Rothko (produced over comparable time periods of 13 years) along particular visual dimensions.
The left image plot shows 128 paintings by Mondrian; the right shows 151 paintings by Rothko. The paintings are organized according to their brightness mean (X-axis) and saturation mean (Y-axis). These measurements were obtained with digital image processing software.